Irrespective of size and domain, collecting and analyzing data is profoundly relevant and resonates with almost all organizations. However, the true potential of high-quality data remains vastly underutilized.
We’ve all heard about the impact and power of data numerous times and, arguably, believe in it too. We’ve all seen and read case studies that can be considered true testimonies, as data has saved billions and trillions of dollars for major global organizations spread across different verticals. Yet, practical business implementation to make use of this data is not as straightforward, as business problems, and the way data is collected, read, and utilized is unique to every organization.
Analyzing and using data in a certain way may have helped an organization immensely in the past but emulating it, in the same way, may not be applicable or usable even though it may be in the same domain. Thus, the perfect recipe to collect and utilize data in the most optimal manner remains unanswered. Unfortunately, no one can provide direct answers or provide insightful direction unless an expert can take a deep dive and review available data as well as understand the vision and goal of the organization.
This article provides high-level directions to unleash the power of data by ensuring a basic understanding of data mining techniques.
Data Mining is a three-step process:
-
Quantifying Data:
Quantification is the process of structuring data in a standardized form of measurement that allows statistical procedures and mathematical calculations. Often, data is collected and stored in an unstructured format, so the obvious first step is to standardize it to make it readable. One must remember that the output is as good as the input – the data will be reliable only if quantification is done based on data that is authentic, precise, and measurable.
-
Using data to identify patterns:
Once quantification is done, one can review and analyze data to identify patterns that are driving results. This may not be straightforward and may require slicing and dicing the data in different ways based on the business problem that you are trying to solve, or the objective you plan to achieve. At a high level, the trends may seem obvious, and one may feel common sense and experience would draw similar interpretations. Plenty of us insights professionals fall into this trap and do not put in the effort to quantify and analyze data in greater detail beyond the surface. It is essential to consciously remind ourselves to keep reviewing the data, to stay nimble, and to adapt to the dynamic business requirements.
-
Using data to make informed decisions:
Once you successfully identify patterns driving success and business performance, you are in a conducive position to make informed decisions. The more data you have and the larger the time span of the collection of the data, the more confidence and reliability businesses have, to make highly calculated and planned decisions about the future.
To summarize, the process of sorting and quantifying large data sets to identify patterns can help in making more informed business decisions.
Almost every organization has a substantial amount of potentially actionable data that is underutilized though they may believe that they are using it, and are data-driven. Even some of the largest organizations fail to utilize easily accessible data to its true potential. Conversely, you don’t need to be a large organization or even use sophisticated tools or technology to reap the benefits of data mining. This technique can be leveraged at an individual level as well.
Leveraging Patterns for Success
Let’s look at an example to understand how impactful simple data can be. You may be familiar with this example if you have read the book ‘Direct from Dell’ by Michael Dell, the founder of Dell Computer Corporation. At the very start of his book, he mentions that at the age of sixteen, he took up a summer job selling newspaper subscriptions. The newspaper would provide a list of phone numbers to all their salespeople who were required to sell via cold calling. Understandably, the overall success ratio of calls was very low, which meant that the commission was not lucrative compared to the effort it demanded. Since he was data-driven, after doing this for a few days and creating a data set, he quantified all the calls he made and successfully managed to identify a pattern. There were two kinds of people who almost always bought subscriptions: people who just got married and people who had just moved into a new house. He now knew his target audience.
He collected names and addresses of the newly (or soon to be newly) married couples through county clubhouses where this data was publicly available. For the people who just moved to a new house, he reached out to companies providing lists of people who applied for mortgages. The list was ranked by the size of the mortgage, and the ones with the largest mortgage were the highest potential customers. Identifying patterns helped him channel his efforts in the right direction and earn thousands of subscriptions. He was such a massive success that while filing tax returns, his economics teacher thought he missed a decimal in the income value. When she realized, he hadn’t, she was left totally shell-shocked as this (then) sixteen-year-old had made more money than her that year, through a summer job!
Even today, this example inspires professionals to try and utilize their ‘sales efforts data’ to identify patterns that can empower them to achieve more tremendous success. Even as an organization, you can always harness available data to identify new opportunities to grow business or leverage existing resources better to improve efficiency or reduce operational costs.
Hiring Data Exercise
From an organizational standpoint, let’s look at another example that most can easily relate to. Irrespective of domain, all organization goes through the cycle of hiring. Substantial time and resources are spent on hiring the most suitable candidates for the right roles. Almost all organizations have data maintained in some form for all candidates who apply. This data can be quantified by cleaning and systematically arranging it to try and gain more insights. The below table is a theoretical example of high-level quantification of this data:
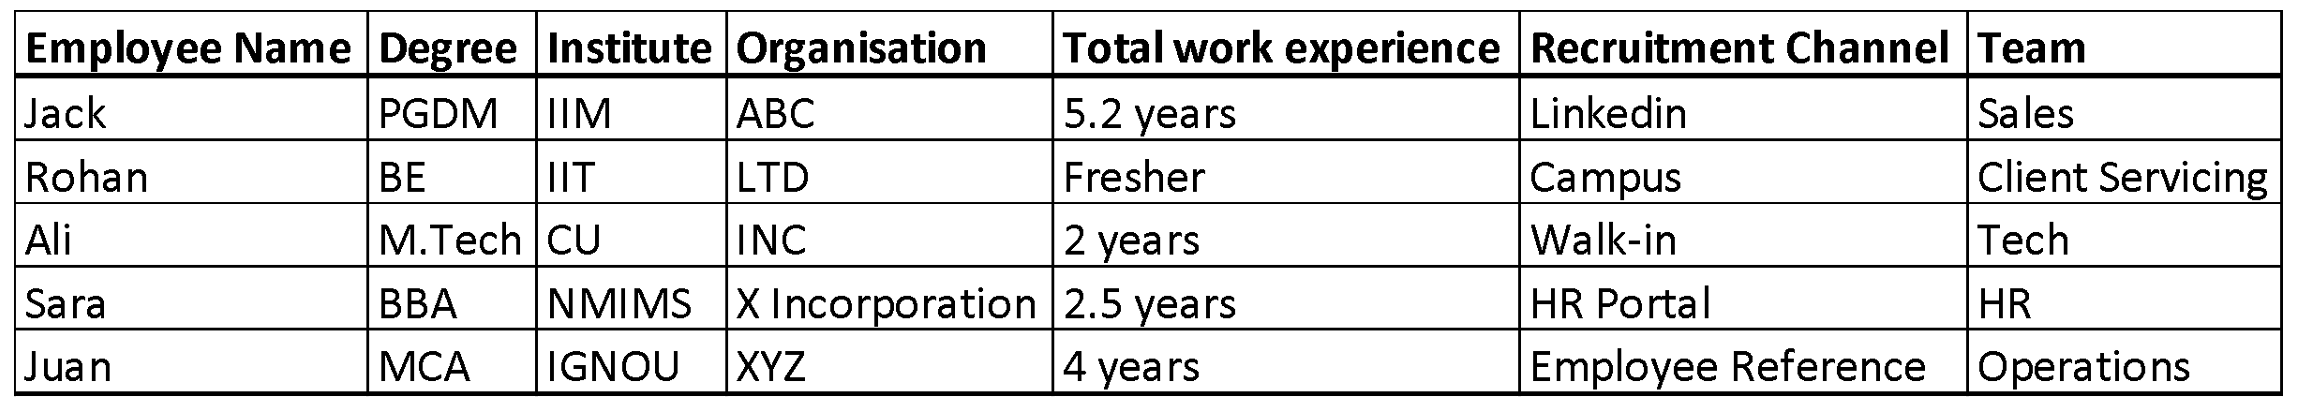
Such data in far more detail would be available for thousands or at least hundreds of candidates who have gone through screening over a period regardless of whether they were hired or not. Once quantification is done, you can try and identify patterns to make new decisions to improve the hiring process. Some basic patterns include:
- The more relevant previous experience a candidate carries, the more suited they could be for the role.
- Candidates with Computer Science or Engineering Degrees are better suited for IT roles.
- Candidates with strong communication skills tend to be more successful in sales and client-facing roles.
Data showing obvious trends should not disappoint you, as it validates reliability in data. Moreover, when deeper dives suggest an unexpected trend (e.g., the best salespeople have a background in food service), there will be confidence in accepting it and identifying reasons behind it, just like the classic case of beer and diaper sales at Walmart on Friday nights.
We can all unleash the power of data and benefit immensely from it. All that is needed is to change the way we make decisions – a shift from gut-based decision-making to embracing data-driven decision-making. You may surprise yourself and achieve success beyond your wildest expectations.
Want to Take a More Data-Driven Approach?
If you are keen to shift your approach to be data-driven and need guidance, reach out to a research data expert you trust. I’m happy to help as well. You may consider reaching out to our in-house team of experts at InnovateMR (info@innovatemr.com) or you may reach out to me directly through LinkedIn. If we can’t solve your business problem, we will guide you to someone who can.

Anand Agrawal has 18+ years of experience in market research client services, operations, and data intelligence. At InnovateMR, Anand leads international operational teams in APAC and Europe in healthcare and growth accounts/sectors specifically. He also has worked to develop, lead, and manage all data reporting matrixes for the global organization, providing clarity for business growth.
InnovateMR is a fiercely independent sampling company that delivers faster answers from business and consumer audiences. As industry pioneers, InnovateMR connects organizations with market research audiences around the world to support informed, data-driven strategies, and identify growth opportunities. InnovateMR has built its reputation on a relentless pursuit of customer delight. Stop working with vendors, and start working with a partner dedicated to your success.
![]()
About InnovateMR – InnovateMR is a full-service sampling and ResTech company that delivers faster, quality insights from business and consumer audiences utilizing cutting-edge technologies to support agile research. As industry pioneers, InnovateMR provides world-class end-to-end survey programming, targeted international sampling, qualitative and quantitative insights, and customized consultation services to support informed, data-driven strategies, and identify growth opportunities. Known for their celebrated status in customer service and results, InnovateMR combines boutique-level service with extensive global reach to achieve partner success.